Line Calculation (1D)
This function allows the user to perform a series of point calculations along a line in a multicomponent system.
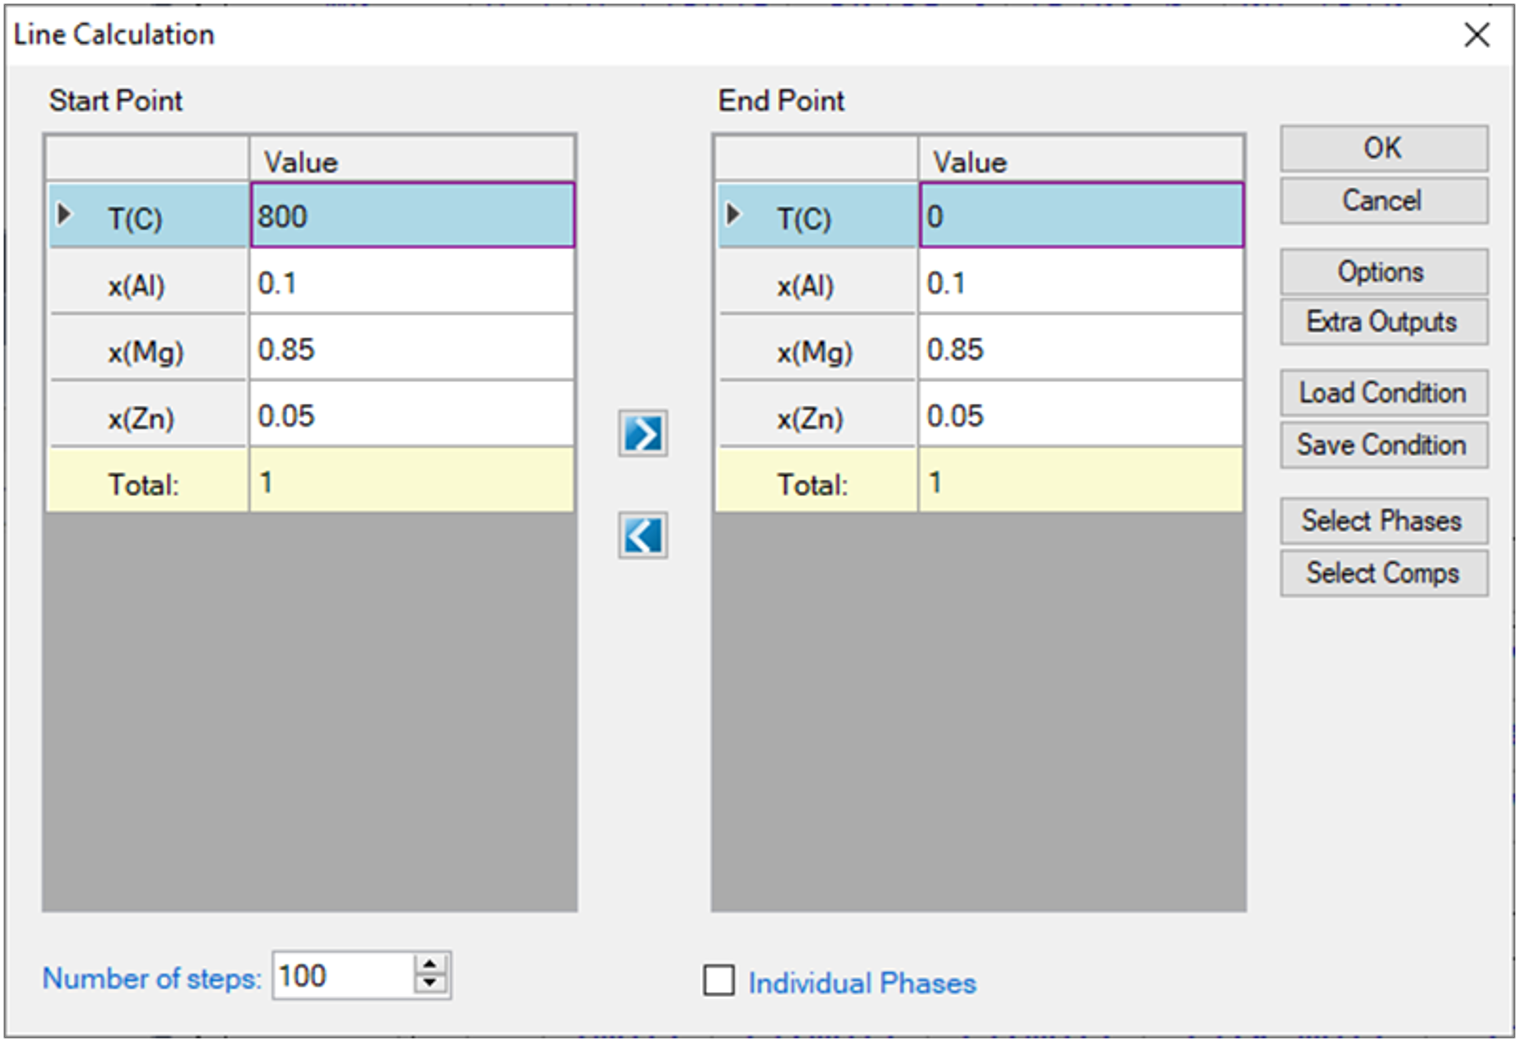
Go to PanPhaseDiagram on the menu bar and select Line Calculation or click the ![]() button on the tool bar. The Line Calculation (1D) dialog box allows the user to set the start and end points of the line, and the number of steps to calculate along the line as shown in Figure 1. User can also access the Options, Extra Outputs, Load Condition, Save Condition, Select Phases, and Select Comps the same way as those in point calculation. Note that the line calculation set up in Figure 1 is along the line of fixing alloy chemistry with varying temperature.
button on the tool bar. The Line Calculation (1D) dialog box allows the user to set the start and end points of the line, and the number of steps to calculate along the line as shown in Figure 1. User can also access the Options, Extra Outputs, Load Condition, Save Condition, Select Phases, and Select Comps the same way as those in point calculation. Note that the line calculation set up in Figure 1 is along the line of fixing alloy chemistry with varying temperature.
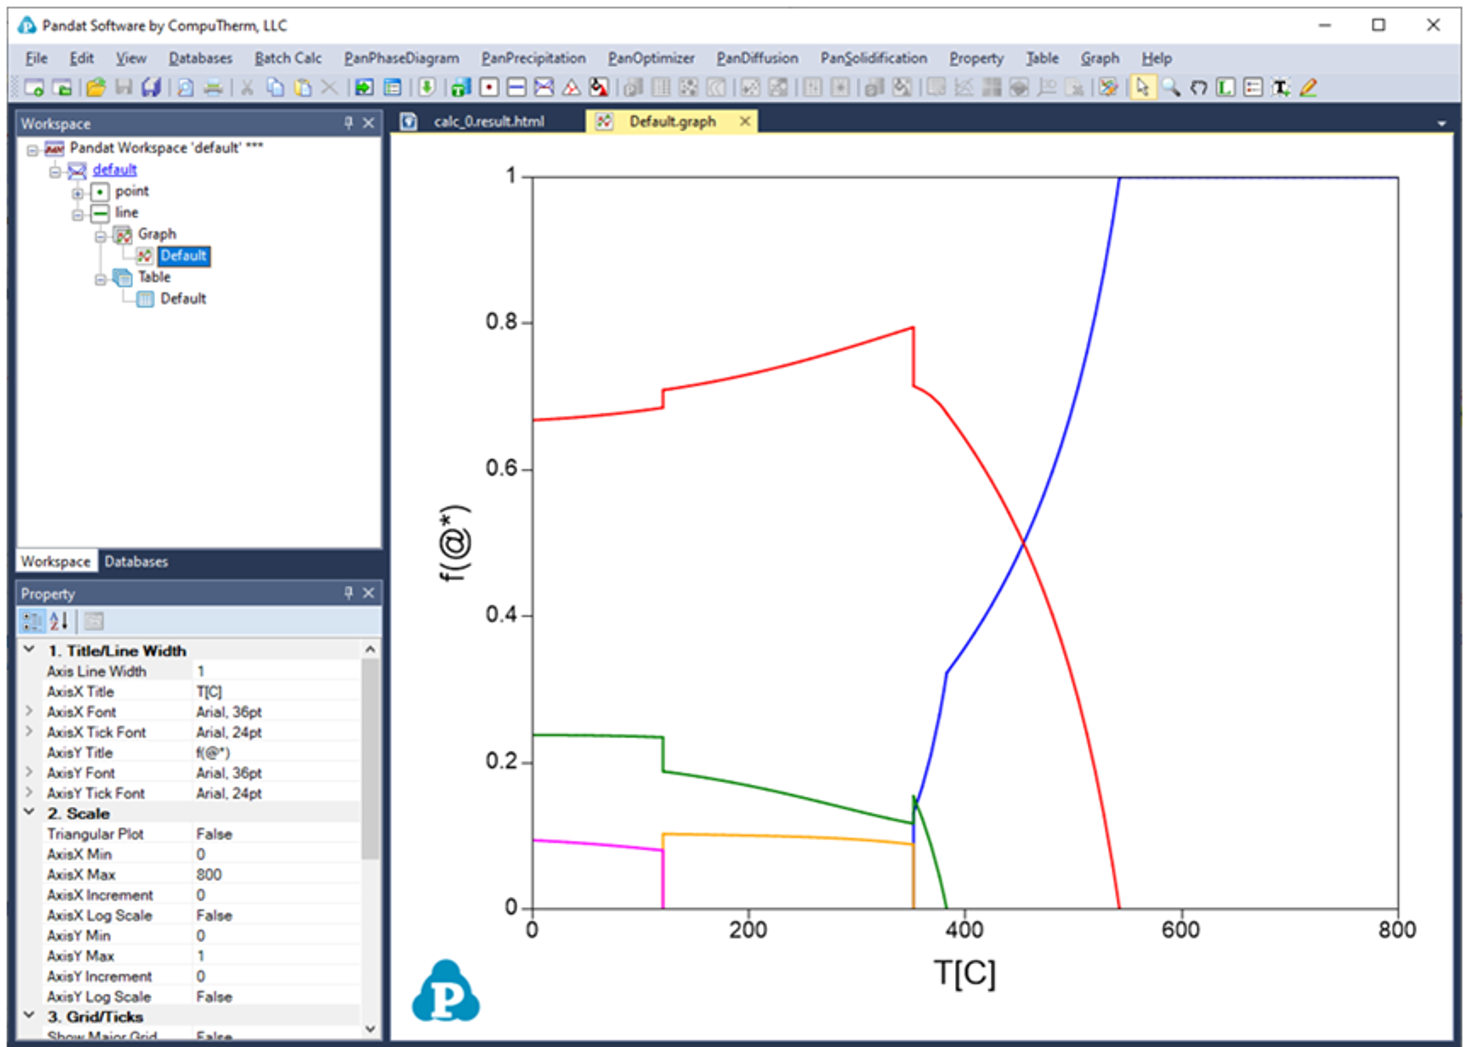
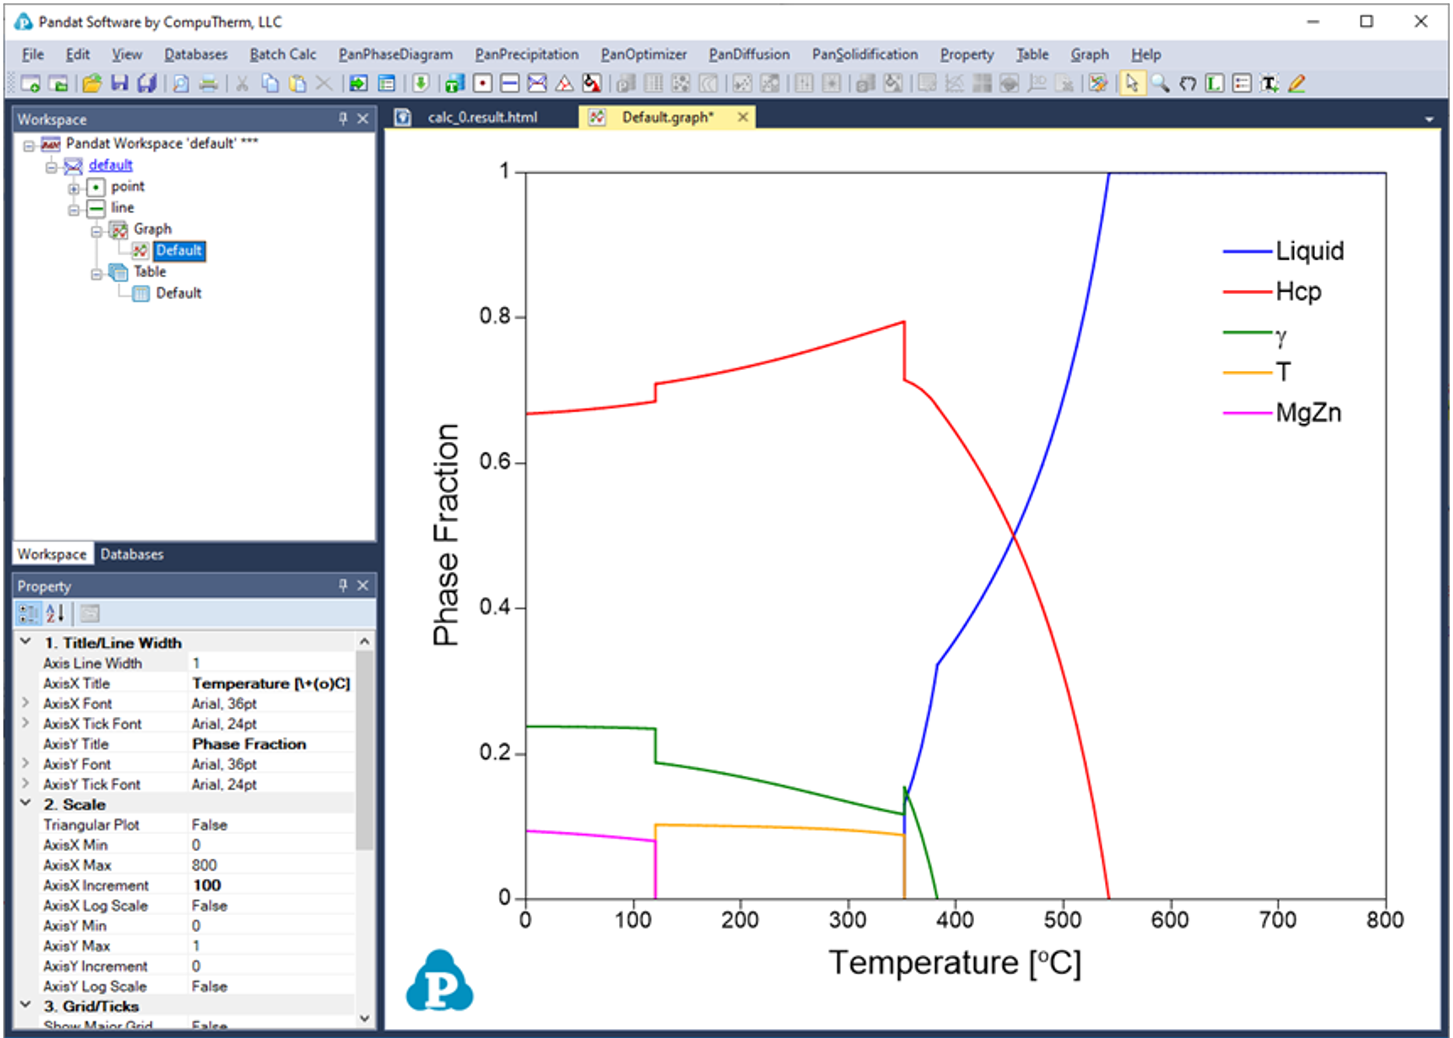
The calculated results are stored in both graph and table. The default graph plots the variation of fraction of each phase with respect to temperature, as shown in Figure 2. User can modify the graph through the Property window by modifying the title, scale and add legend to get a better view as shown in Figure 3. In the Explorer window, user can double click the “Default” under the “Table” tree to view the default table. User can select any columns to create new plots. Furthermore, select the “Table” and right click the mouse, user has the option to Add a New Table to generate new tables and then plot other figures as needed.
It should be pointed out that user can certainly choose to fix the temperature and vary the alloy composition for a line calculation.